You may not realize that the constant of proportionality is a foundational concept in mathematics that underpins many real-world applications.
As you explore this fundamental mathematical principle, you will uncover its significance in understanding relationships between variables.
By grasping the essence of this constant, you will develop a deeper insight into the intricate workings of proportional relationships and their implications in various scenarios.
Understanding the constant of proportionality could be the key to unlocking a whole new level of mathematical understanding.
Definition of Proportionality Constant
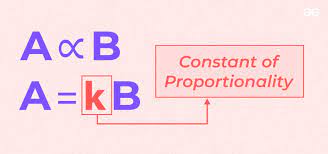
Understanding the concept of the proportionality constant is essential in mathematics for establishing the direct relationship between two variables. The proportionality constant, often denoted by ‘k,’ is a fixed value that relates two quantities that are directly proportional to each other. In simple terms, it signifies how much one variable changes concerning the change in the other variable. For example, in the equation y = kx, ‘k’ represents the proportionality constant, indicating the rate at which y changes with respect to x. This constant is crucial in various mathematical applications, including physics, economics, and engineering.
When you encounter problems involving direct proportionality, identifying and utilizing the proportionality constant is fundamental. By understanding how ‘k’ operates within the context of the relationship between the variables, you can calculate one variable based on the other and make predictions about their behavior. Mastering the concept of the proportionality constant provides a solid foundation for solving proportional relationships efficiently and accurately.
Characteristics and Properties
As you begin exploring the topic of Characteristics and Properties, consider the key points that will shape your understanding.
You’ll find that an overview of the key properties and a detailed analysis of unique characteristics will provide a solid foundation for your further exploration.
Key Properties Overview
Exploring the key properties of the Constant of Proportionality helps clarify its role in mathematical relationships. Understanding these properties is crucial for grasping how two quantities are related in a proportional manner.
One key property is that the Constant of Proportionality remains the same throughout the relationship between variables. This means that as one quantity changes, the other quantity changes in a predictable way based on this constant factor.
Additionally, the Constant of Proportionality is always a non-zero value, as zero would imply a lack of proportionality. Moreover, this constant factor is unique to each proportional relationship, highlighting the specificity and individuality of each mathematical connection.
Unique Characteristics Analysis
To further comprehend the Constant of Proportionality, delve into its Unique Characteristics Analysis, unveiling pivotal traits and properties that define its role in mathematical relationships.
The Constant of Proportionality maintains a consistent ratio between two variables, ensuring that as one quantity changes, the other adjusts proportionally.
One key characteristic is its presence in linear equations, where it acts as the slope determining factor.
Additionally, the Constant of Proportionality is always positive, reflecting the direct relationship between the variables involved.
It serves as the multiplier connecting the input and output values in a proportional manner.
Understanding these unique characteristics is essential for grasping how the Constant of Proportionality influences the behavior and outcomes of mathematical relationships.
Proportionality in Graphs
When looking at points on a graph, you can see how they represent relationships between variables.
Visualizing proportional lines on a graph helps you understand how they maintain a constant ratio.
Graphs Show Relationships
Understanding how graphs represent relationships is essential in grasping the concept of proportionality in mathematics. Graphs visually display how two quantities change in relation to each other. In proportional relationships, the graph typically forms a straight line passing through the origin (0,0).
This straight line indicates that the two quantities are directly proportional, meaning they increase or decrease together at a constant rate. When graphing proportional relationships, you’ll notice that as one quantity doubles, the other also doubles, showcasing the constant of proportionality.
Proportional Lines Visualization
In grasping the concept of proportionality in mathematics, visualizing proportional lines in graphs is crucial for understanding the constant of proportionality. Proportional lines are straight lines that pass through the origin and have a constant slope, indicating a direct relationship between the variables.
When you plot proportional data points on a graph, you’ll notice that they fall on a straight line. This visual representation helps you see how changes in one variable relate to changes in the other. By examining the steepness of the line, you can determine the constant of proportionality, which remains the same throughout.
Understanding proportional lines in graphs enables you to interpret the relationship between quantities accurately and make predictions based on this relationship.
Calculating Proportional Relationships
To calculate proportional relationships effectively, begin by determining the constant of proportionality between the two quantities involved. The constant of proportionality is represented by ‘k’ in mathematical terms. This constant signifies the ratio between the two quantities and remains the same throughout the relationship.
To find ‘k’, you can divide the value of one quantity by the corresponding value of the other. For example, if you have quantities x and y that are proportional, you can calculate k by dividing y by x (k = y/x).
Once you have found the constant of proportionality, you can use it to predict one quantity based on the other in the relationship. If you know the value of one quantity, multiplying it by the constant of proportionality will give you the value of the other quantity.
Understanding how to calculate the constant of proportionality is essential for working with proportional relationships in various mathematical contexts.
Real-World Applications
Explore how the constant of proportionality is applied in real-world scenarios to analyze and predict relationships between varying quantities.
In everyday situations, understanding proportionality helps in making sense of the relationship between different variables. For instance, in a business setting, the constant of proportionality can be used to determine how changes in input quantities affect output.
If you run a bakery, knowing the constant of proportionality allows you to predict how the amount of flour affects the number of loaves of bread you can produce.
Similarly, in physics, the constant of proportionality is crucial for analyzing concepts like speed and distance. By utilizing this mathematical principle, scientists can predict how changes in speed will impact the distance traveled.
Moreover, in finance, the constant of proportionality is used to calculate interest rates on loans or investments. Understanding how this constant works in various real-world scenarios enables better decision-making and forecasting based on reliable mathematical relationships.
Proportionality Vs. Direct Variation
When distinguishing between proportionality and direct variation, it’s important to understand the fundamental differences in how they represent relationships between varying quantities. In proportionality, the relationship between two quantities is such that as one quantity changes, the other also changes, but their ratio remains constant. This means that if you were to graph the relationship between the two quantities, you’d see a straight line passing through the origin.
On the other hand, direct variation is a specific type of proportionality where the two quantities have a constant ratio and pass through the origin, but in this case, that constant ratio is equal to one. This implies that the two quantities increase or decrease together in a linear fashion. In essence, direct variation is a subset of proportionality, where the constant of proportionality is equal to one.
Understanding these distinctions can be crucial when working with mathematical models and real-world applications that involve varying quantities.
Challenges and Exercises
Getting a good grasp of the challenges and exercises related to mathematical fundamentals can greatly enhance your understanding of the constant of proportionality. When faced with exercises involving the constant of proportionality, remember to pay close attention to the given data and the relationships between the variables. One common challenge is identifying the correct units for the constant of proportionality, as this can impact your calculations significantly. To overcome this, practice converting units and ensure all values are in the same unit before proceeding with your calculations.
Another exercise that can enhance your understanding is graphing proportional relationships. Plotting points on a graph and observing how they lie on a straight line can reinforce the concept of proportionality and help you visualize the constant of proportionality. Additionally, working through word problems involving proportional relationships can strengthen your problem-solving skills and application of the constant of proportionality in real-life scenarios. By tackling these challenges and exercises head-on, you’ll build a solid foundation in understanding the constant of proportionality and its significance in mathematical contexts.
Frequently Asked Questions
Yes, the constant of proportionality can be negative when dealing with inversely proportional relationships. In such cases, as one quantity increases, the other decreases at a constant rate. Remember this when analyzing proportional relationships.
In linear relationships, the constant of proportionality stays the same throughout, directly relating x and y. In non-linear relationships, this constant changes as x and y values vary, showing a more complex connection.
In some scenarios, the constant of proportionality can fluctuate over time due to changing factors or conditions. It’s essential to monitor these changes to accurately represent the relationship between the variables involved.
Conclusion
So, now you understand the importance of the constant of proportionality in mathematical relationships. Remember, it’s the number that keeps everything in balance, ensuring that as one quantity changes, the other changes in a predictable way.
Whether you’re graphing, calculating, or applying it to real-world situations, knowing how to work with proportionality constants will help you navigate the world of mathematics with confidence. Keep practicing and exploring to deepen your understanding of this fundamental concept.


