Imagine you’re a chef preparing a new recipe, carefully selecting ingredients that will complement each other and create a symphony of flavors.
In the world of data analysis, Excel covariance is like that secret ingredient that helps you uncover hidden relationships between variables. It allows you to measure the degree to which two sets of data move together, providing valuable insights for decision-making.
But how can you master the art of Excel covariance and unleash its full potential?
Stay tuned as we unravel the secrets and techniques that will take your data analysis skills to the next level.
Understanding Covariance in Excel
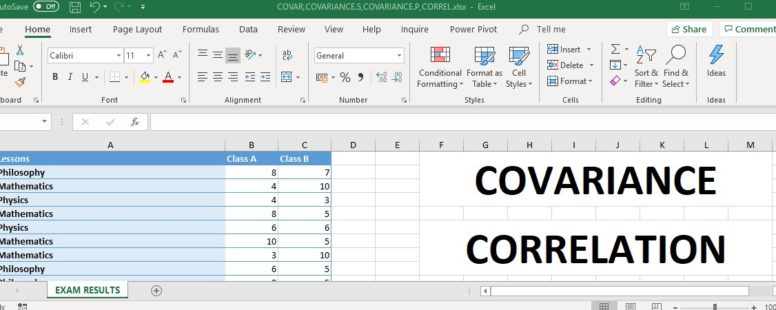
To understand covariance in Excel, you can use the COVARIANCE function to calculate the measure of the relationship between two sets of data. Covariance is a statistical measure that quantifies the relationship between two variables. It tells you how changes in one variable are associated with changes in another variable. By calculating covariance in Excel, you can determine whether the two sets of data move together or in opposite directions.
The COVARIANCE function in Excel takes two arguments: a range of values for the first variable and a range of values for the second variable. It then calculates the covariance between these two sets of data. The result is a single number that indicates the strength and direction of the relationship. A positive covariance means that the two variables move together, while a negative covariance means they move in opposite directions.
Understanding covariance in Excel is useful in various fields, such as finance, economics, and data analysis. It helps you identify the degree of dependence between two variables and evaluate how they might influence each other. By utilizing the COVARIANCE function, you can gain insights into the relationship between different sets of data and make informed decisions based on the results.
Importance of Covariance in Data Analysis
Understanding covariance in Excel is essential in data analysis as it allows you to assess the degree of dependence between two variables and determine how they may impact each other. Covariance provides valuable insights into the relationship between variables, helping you make more informed decisions and predictions.
By calculating covariance, you can determine whether two variables move in the same direction (positive covariance) or in opposite directions (negative covariance). This information is crucial in identifying patterns and trends within your data. For example, if you’re analyzing the relationship between advertising expenditure and sales revenue, a positive covariance suggests that increasing advertising expenditure is likely to lead to an increase in sales.
Covariance also plays a crucial role in portfolio analysis and risk management. By examining the covariance between different assets or investment options, you can assess the diversification potential and risk associated with your portfolio. This information helps you make informed decisions about asset allocation and risk management strategies.
Furthermore, covariance allows you to quantify the strength of the linear relationship between variables. By comparing the covariance values of different pairs of variables, you can determine which relationships are stronger or weaker. This knowledge is valuable for identifying significant relationships and focusing your analysis on variables that have a stronger impact on each other.
Setting Up Your Data for Covariance Calculation
To calculate the covariance in Excel, you need to set up your data correctly. Before you begin, make sure that you have two sets of data that you want to analyze for their covariance. Each set of data should be organized in a separate column, with each entry corresponding to a specific observation or measurement. It’s important that both sets of data have the same number of observations, as the covariance calculation relies on pairs of values from each set.
Next, ensure that your data is properly labeled. Use the first row of each column to provide clear and descriptive headers for your data. This will help you identify and reference the correct sets of data when performing the covariance calculation.
Additionally, ensure that there are no missing or empty cells in your data. Covariance calculations require complete and consistent data sets. If there are any missing values, either remove them or replace them with suitable placeholders, such as zeros or the average value of the data set.
Performing Covariance Calculation in Excel
To calculate the covariance in Excel, you can utilize the built-in COVARIANCE.P or COVARIANCE.S functions. These functions are specifically designed to provide you with accurate covariance calculations based on your data.
COVARIANCE.P is used when your data represents the entire population, while COVARIANCE.S is used when your data represents a sample of the population.
To use either of these functions, you need to select a range of cells that contain the corresponding variables for which you want to calculate the covariance. Then, simply enter the formula ‘=COVARIANCE.P(range1, range2)’ or ‘=COVARIANCE.S(range1, range2)’ into a cell, where ‘range1’ and ‘range2’ are the ranges of cells containing the variables.
Press Enter, and Excel will calculate the covariance.
It’s important to note that the COVARIANCE.P and COVARIANCE.S functions are case-sensitive, so make sure to use uppercase letters when inputting the formula.
Interpreting and Analyzing Covariance Results
Now that you have calculated the covariance using Excel, it’s time to interpret and analyze the results.
Covariance measures the relationship between two variables, indicating whether they move together or in opposite directions. Understanding the meaning and importance of covariance will help you make informed decisions based on the data.
Additionally, exploring different covariance calculation methods can provide valuable insights into the relationship between variables.
Covariance: Meaning and Importance
Understanding the meaning and importance of covariance results is crucial for interpreting and analyzing data in Excel.
Covariance measures the relationship between two variables, indicating how they vary together. A positive covariance suggests that the variables move in the same direction, while a negative covariance indicates they move in opposite directions. The magnitude of the covariance indicates the strength of the relationship.
However, interpreting covariance alone can be challenging since it isn’t standardized and depends on the units of measurement. To overcome this limitation, it’s common to use the correlation coefficient, which is a standardized version of covariance, ranging from -1 to 1.
Covariance is important because it helps identify patterns, relationships, and dependencies between variables, enabling better decision-making and understanding of data.
Covariance Calculation Methods
Covariance calculation methods play a crucial role in interpreting and analyzing the covariance results, allowing you to gain valuable insights into the relationship between variables.
There are various methods available to calculate covariance, each with its own advantages and limitations.
The most common method is the sample covariance, which is used to estimate the covariance of a sample based on a subset of the data. This method is suitable when you have a limited amount of data available.
Another method is the population covariance, which calculates the covariance of an entire population. This method is more accurate when you have complete data for the entire population.
Advanced Tips and Tricks for Excel Covariance
To enhance your Excel Covariance skills, consider implementing these advanced tips and tricks.
Firstly, take advantage of the array formula feature in Excel. By using an array formula, you can perform multiple calculations simultaneously, saving you time and effort. To do this, select the desired range of cells and enter the formula using Ctrl + Shift + Enter. This will automatically enclose the formula in curly brackets, indicating that it’s an array formula.
Another useful tip is to use named ranges in your formulas. By assigning a name to a specific range of cells, you can make your formulas more readable and easier to manage. To do this, select the range of cells, go to the Formulas tab, click on Define Name, and enter a name for the range. Then, instead of referencing the cells by their cell references, you can use the name in your formulas.
Additionally, you can use the covariance function in combination with other functions to perform more complex calculations. For example, you can use the covariance function with the IF function to calculate conditional covariance. This allows you to analyze the relationship between variables based on specific criteria.
Frequently Asked Questions
Can Covariance Be Calculated for Non-Numerical Data in Excel?
No, covariance cannot be calculated for non-numerical data in Excel. Covariance is a measure of the relationship between numerical variables, so it requires numerical data to perform the calculation accurately.
How Can I Handle Missing Values in My Data When Calculating Covariance in Excel?
To handle missing values when calculating covariance in Excel, you can use the COVAR.S or COVAR.P function. These functions automatically ignore any missing values in the data range, giving you an accurate covariance calculation.
Can I Use Excel’s Covariance Function to Calculate the Covariance Between More Than Two Variables?
Yes, you can use Excel’s covariance function to calculate the covariance between more than two variables. It is a powerful tool that allows you to analyze the relationships between multiple sets of data.
What Are Some Common Pitfalls or Errors to Avoid When Performing Covariance Calculations in Excel?
When performing covariance calculations in Excel, avoid these common pitfalls: not selecting the correct data range, using incorrect formulas, forgetting to adjust for sample size, and not considering the interpretation of the results.
Are There Any Limitations or Assumptions to Consider When Interpreting Covariance Results in Excel?
When interpreting covariance results in Excel, you should be aware of limitations and assumptions. These include the assumptions of linearity and independence, as well as the limitation of only providing a measure of linear relationship.
Conclusion
In conclusion, mastering the art of Excel covariance is crucial for effective data analysis.
By understanding the concept of covariance and its significance, you can set up your data accurately and perform calculations with ease.
Interpreting the results will provide valuable insights for making informed decisions.
With the advanced tips and tricks for Excel covariance, you can elevate your data analysis skills to a professional level.
So, embrace the power of Excel and unlock the potential of covariance in your data analysis journey.


